Digital Products and Processes:
Take smart data visualization solutions to the next level of efficiency.
.
Frontend
Use Cases

Digital interfaces
individually tailored to your requirements

"Lemonize has transformed our data into a tangible product. Now, our customers can use it to make decisions instead of just reading PDFs." - Project Manager Digital Services, Construction Industry
More insights
Less effort

Would you like to visualize complex machine data, accelerate decision-making processes, or develop new digital services?
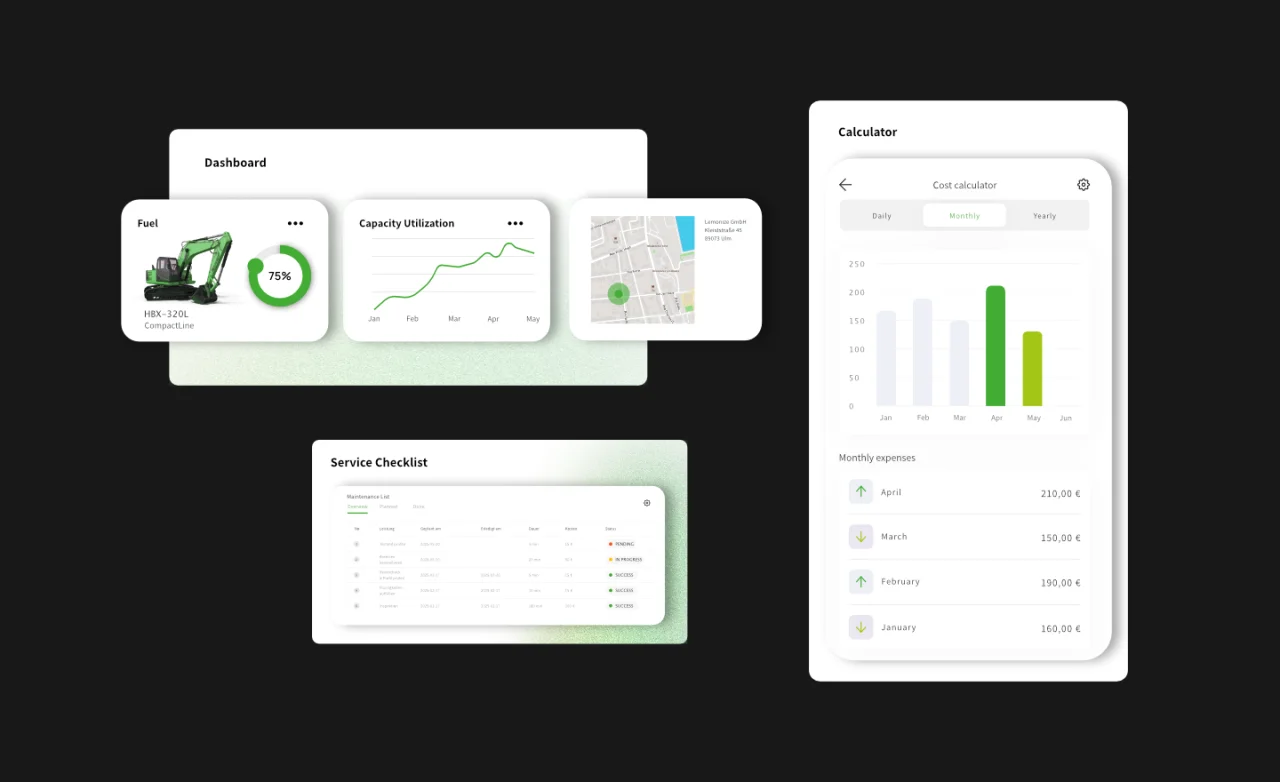
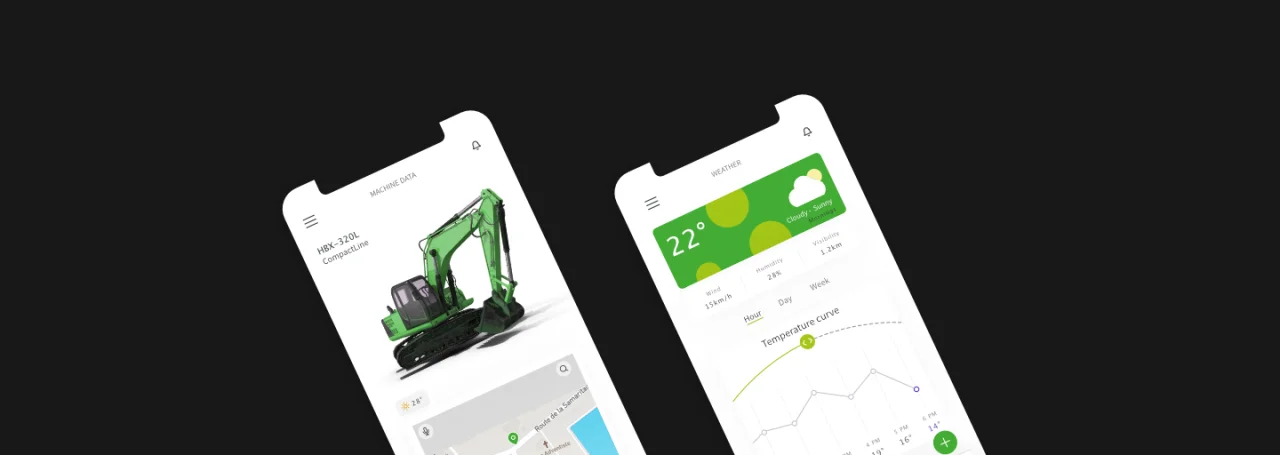
We transform your process and machine data into intuitive digital products, such as smart construction dashboards, TCO calculators, and individually developed data visualization solutions, with our expertise in interactive front-end data visualizations.
Visualize complex data.
We transform raw data into tangible insights using intuitive visualizations.
Data analysis.
Interactive dashboards and targeted evaluations show trends, patterns and deviations at a glance.
Make data-driven decisions.
Well-visualized figures enable well-founded, data-driven decisions.
Optimize Performance.
Visualized key figures reveal bottlenecks and potential areas for improvement, allowing for the efficient use of resources.

In facts & figures

Mobile apps improve communication on construction sites, enable immediate updates and fast responses - and thus increase efficiency by up to

+25%

The use of IoT in the construction industry improves resource allocation, communication and decision-making - with cost savings of up to

+29%

Start your data-driven future now with our customized front-end solutions. Rethink your digital processes.
WHY
Lemonize

Our strengths at a glance

Mockups Daten-Visualisierungs-Lösungen.
Now
Make an appointment

Schedule your free 30-minute consultation with our expert, Lara, to learn how you can maximize the potential of your data.

As specialists in data-driven front ends and interactive visualization solutions, we help companies make complex processes and machine data understandable, usable, and visually accessible.

In a brief demo, we will show you how individual visualizations can help you identify trends early on, manage processes more transparently, and make better decisions. This allows you to transform your data into a digital product that creates real added value for your team, customers, and processes.

Get in touch with us

Do you have data that is poorly presented and therefore of little use to you? Tables, reports, and isolated tools provide figures but no real overview. Then it's time for visualization to create clarity. With interactive dashboards and data-driven front ends, we make complex information understandable and usable, precisely tailoring it to your processes and users.

Still have questions? Contact us now!

Icon E-Mail.
lara.maslowski@lemonize.de
Icon Telefon.
0731 / 602 601 00
Lara Maslowski.

FAQ